Indicators for Institutions and the OpenAIRE MONITOR
Acknowledge, understand and place thyselves in the research landscape unlocking Research Excellence
In order to shed light on the importance of monitoring research outputs and to unveil the functionalities of the OpenAIRE Monitor, the second GraspOS online training event drew 35 participants from various institutions. Leonidas Pispiringas, Scholarly Communication Technical Expert at OpenAIRE, led the session, with Zenia Xenou, Engagement & Training Officer at OpenAIRE, moderating the event.
In this post, we provide you with a summary of the training, highlighting the main points.
Understanding the Why: Research Output Monitoring for Institutions
The event kicked off with an exploration of the reasons why institutions should actively monitor their research outputs.
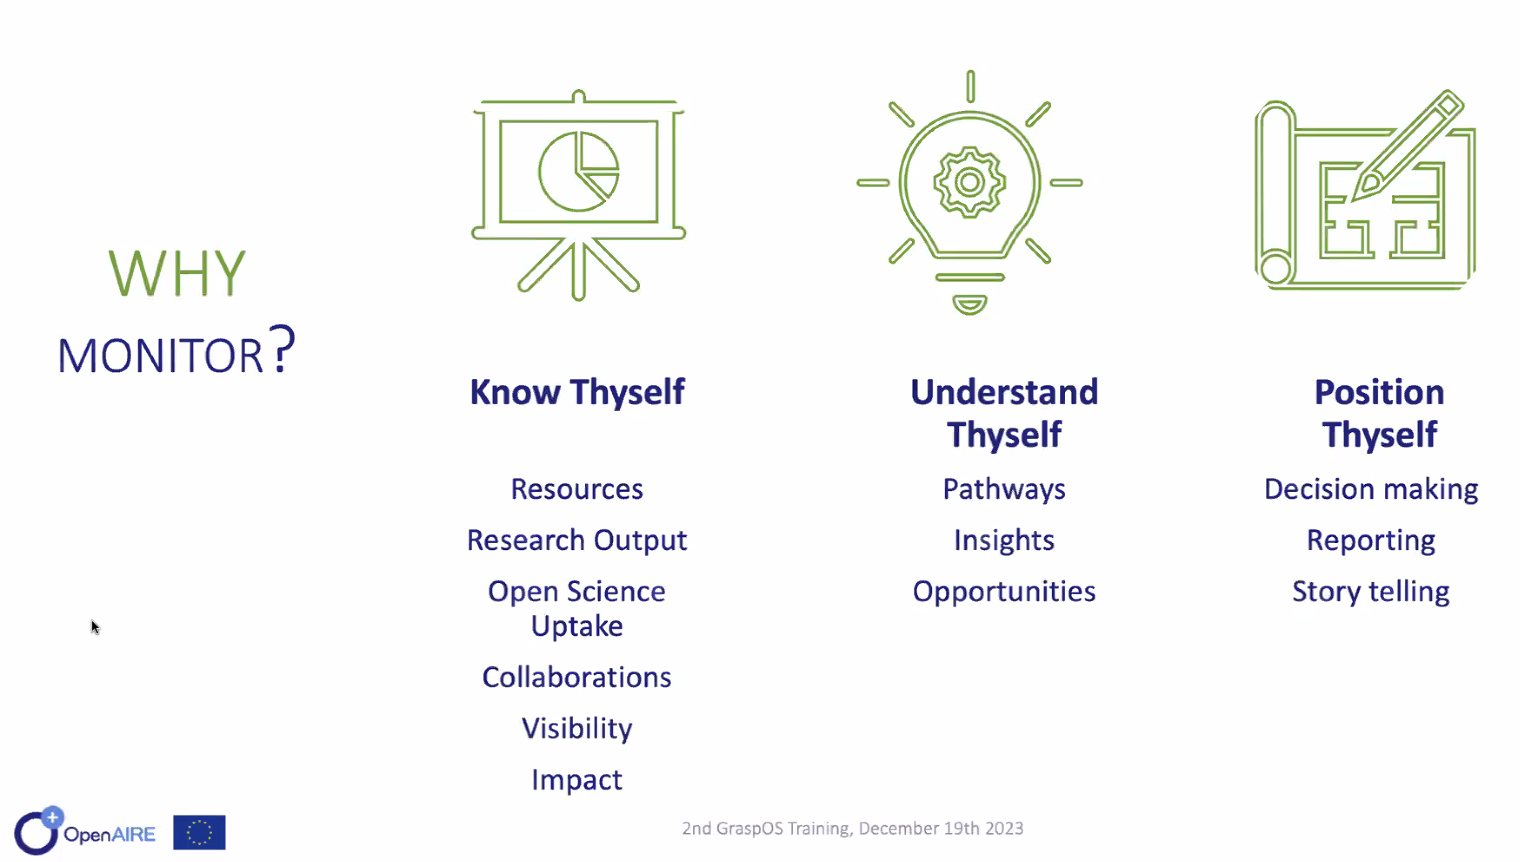
Leonidas Pispiringas emphasised the need for institutions to "know thyself" by identifying resources used for research output production, the number of research outputs produced by affiliated researchers, collaborations. The process then moves to "understand thyself," wherein pathways, insights, and opportunities for research production are identified. Finally, institutions are encouraged to "position thyself" through informed decision-making, strategic initiatives, reporting, and compelling storytelling.
Unveiling the OpenAIRE Monitor: Methodological Principles and Features
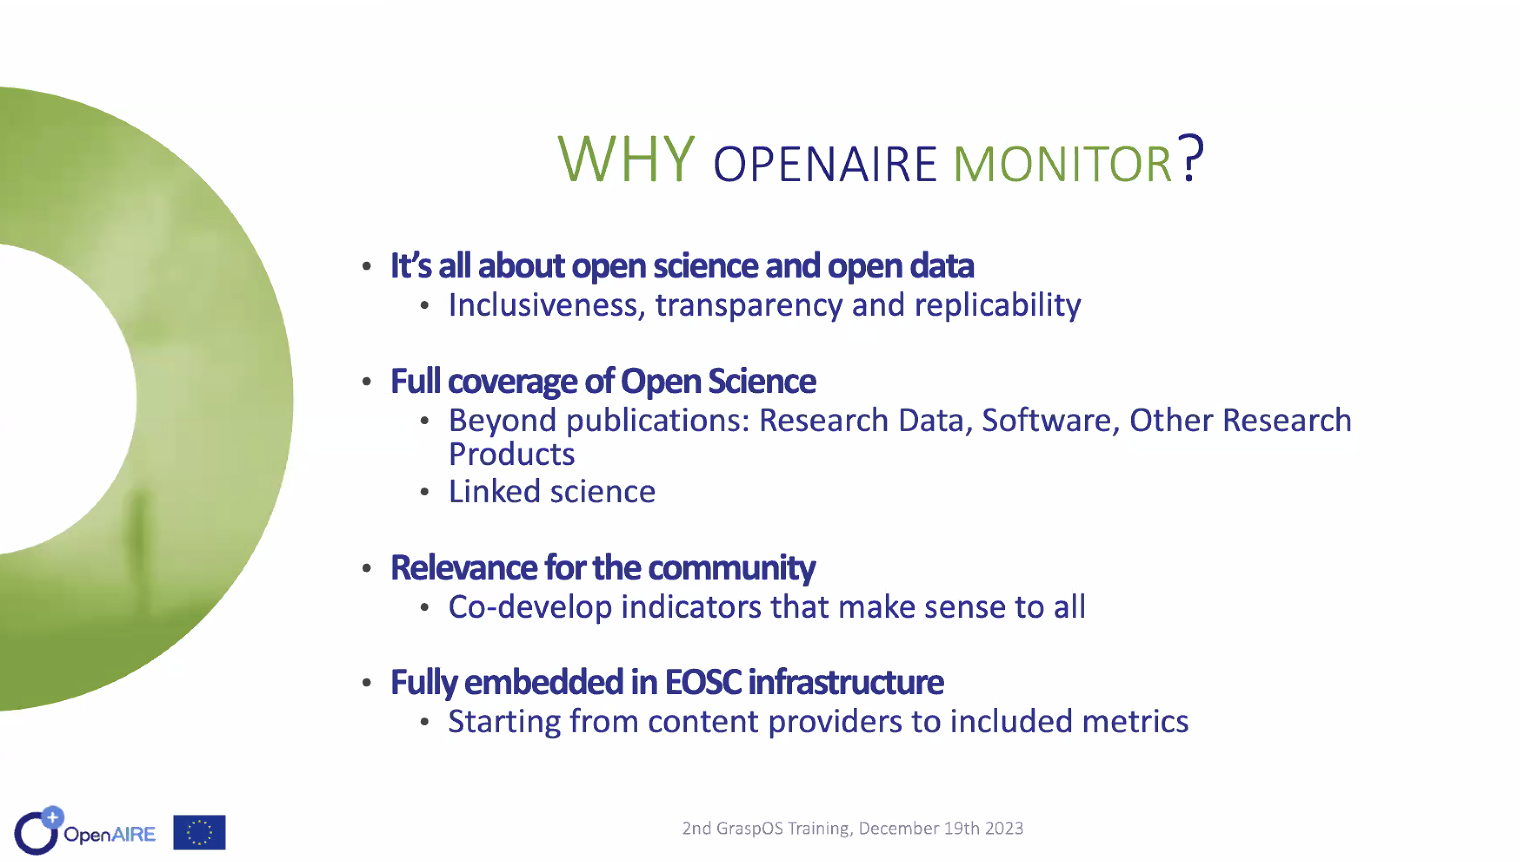
Leonidas Pispiringas highlighted the relevance of the OpenAIRE Monitor in this context, focusing on its methodological principles and the underlying infrastructure. The platform operates on Open Science (OS) and Open Data (OData) principles, providing a dashboard-on-demand approach. The dashboard is a community-led initiative which offers indicators on collaboration, institutional openness, Sustainable Development Goals (SDG) contribution, and publication production.
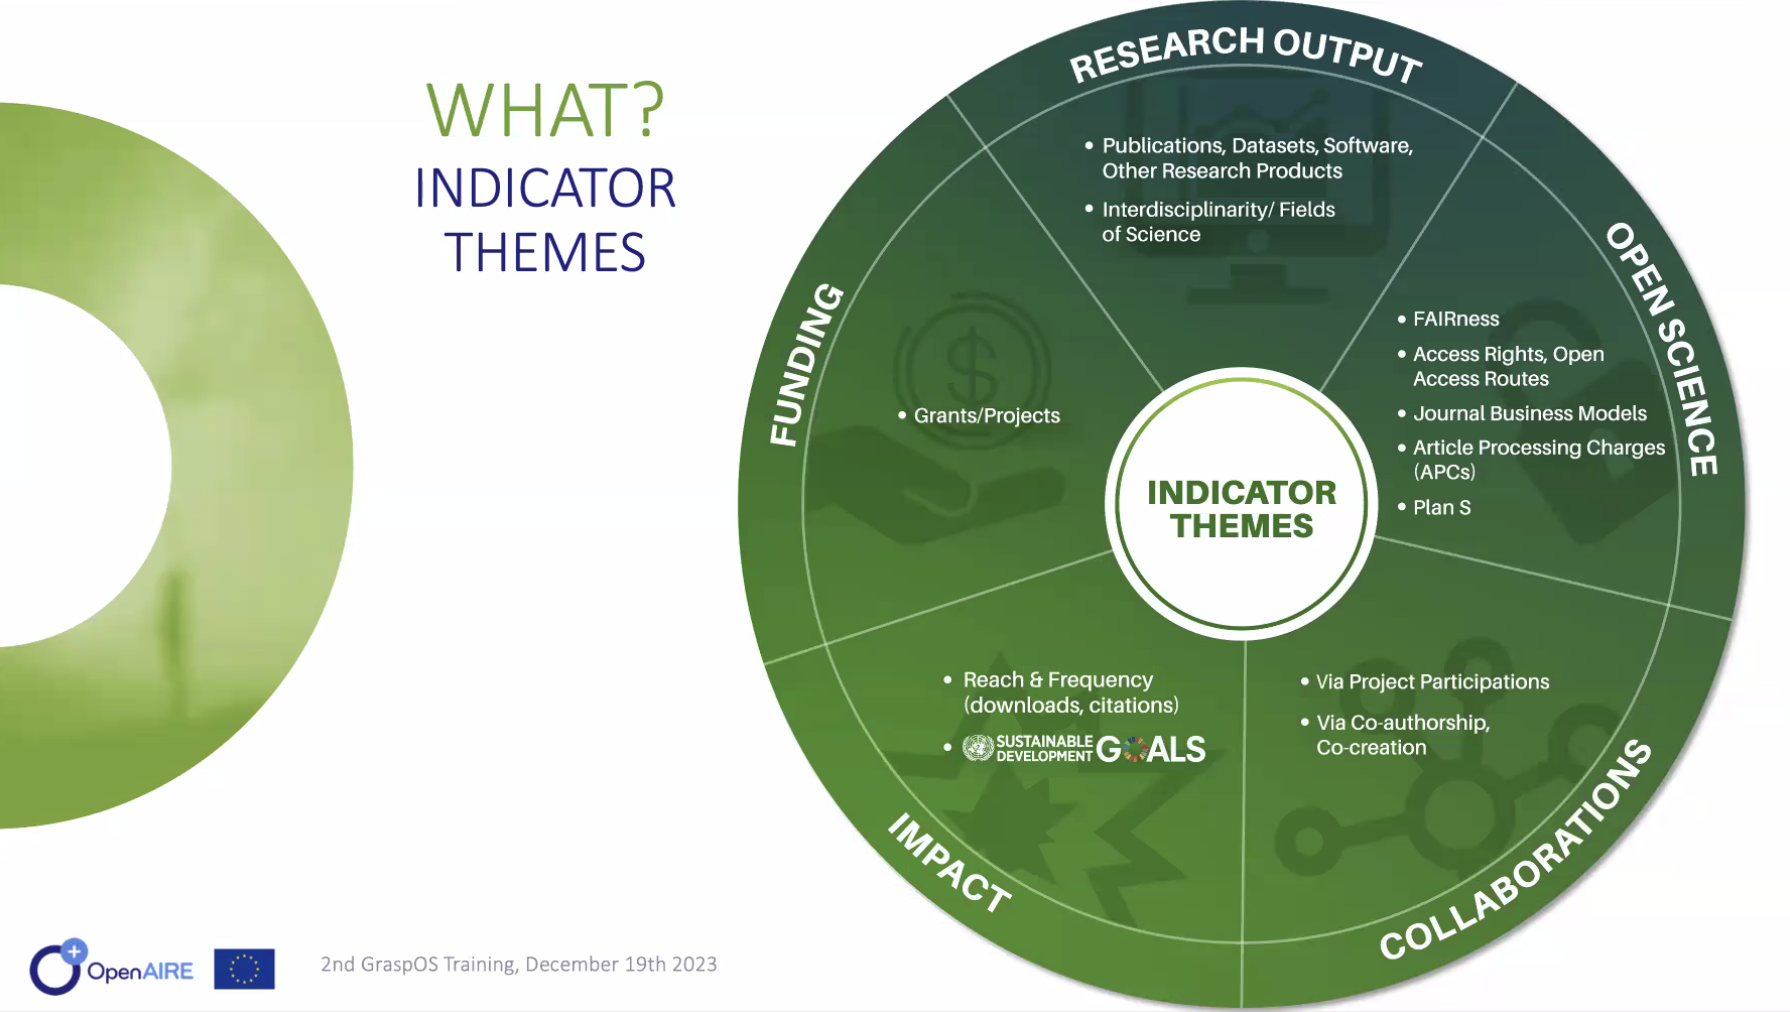
The indicators are grouped in themes, covering Funding, Research Output, Open Science, Collaborations, and Impact. Within each theme, indicators are categorised based on research production type, domain (Field of Science), time, country, data sources, and funders.
Features of OpenAIRE Monitor: Navigating the Dashboard
The Institutional dashboards feature interactive visualisations, export capabilities in various formats, and filtering options. Users have control over sharing preferences, choosing between public, restricted, and private modes for themes and indicators.
Participants gained insights into the Institutional Dashboards during the demonstration which showcased specific features and data visualisations within each theme, based on the dashboard of the University of Minho:
- Funding: Overview of funding in time, including European Commission projects, possibility to filter by program (FP7, H2020 data are available, Horizon Europe will be soon).
- Research Output: Publications by type, time, data source, publisher, along with indicators for peer-reviewed publications and Field of Science.
- Open Science: Composite indicators such as openness and findability scores, visualisations for publications by access rights, including over time, as well as insights into datasets and software.
- Collaborations: Geographic distribution of collaborations and the top 20 collaborating organisations, based on project collaborations.
- Impact: Indicators for reach and frequency, including total downloads and citations, broken down by access route and Field of Science.
The aim of the training was to highlight how the institutional dashboard of the OpenAIRE MONITOR service can enhance research assessment and decision-making processes for institutions. By providing comprehensive Open Access, collaboration, and impact metrics and indicators, this dashboard offers a nuanced understanding of an institution's research landscape.
The slides from the training are available on Zenodo: DOI 10.5281/zenodo.10406679

